NatGasWeather.com Launches Speed Trend Live HDD/CDD Statistics
NatGasWeather.com/RM Weather Consultants is pleased to announce an enhanced version of our Live HDD/CDD weather model statistics. To calculate HDD/CDD values for a given day requires a maximum and minimum temperatures, thereby needing to sample a full day’s temperatures data from the weather models before a final calculation can be made. Since it takes nearly 15 minutes for NOAA to process a full day’s weather data for the GFS model, and 5 minutes for the ECMWF to process a full day of the EC model, at NatGasWeather.com we have developed a proprietary method to calculate intraday forecast HDD/CDD trend statistics as the GFS and ECMWF weather models are processing to give as much as a 10 minute lead time for the GFS ensemble data, and a 2-3 minute lead time for the European (ECMWF) ensemble data. The data from the ECMWF processes considerably faster than NOAA’s GFS and why the lead time is only a few minutes (NOAA’s GFS ensemble takes nearly 3-hours for them to process their 16-day forecast , while the ECMWF ensemble data only takes 1-hour to process their 15-day EC forecast). Most importantly, the new Speed Trend method we developed will give traders an advantage through a greater lead time in how a new forecast day is trending in both the GFS and EC CDD/HDD data before a final value is locked in.
Here we describe details on how the new Speed Trend is displayed in our Live HDD/CDD tables. Before getting into the specifics, be sure to either empty your web browsers cache or use an “incognito” browser to ensure the recent upgrade to the new LIVE HDD/CDD Speed Trend data loads correctly. Once done, you will note in the Live HDD/CDD tables in the new Speed Trend method will show a 12 and 24-hour trend in the far right columns and marked with asterisks, highlighting it’s working on the intraday forecast trend for the next forecast day. In the sample image below, you will see the forecast has been completed for Day-7 (June 11) and the calculations are already underway for forecast Day-8 (June 12), with the trend at that point in the process/calculation showing gains of 0.26 TDDs vs 12-hours ago and gains of 0.89 TDDS vs 24-hours ago.
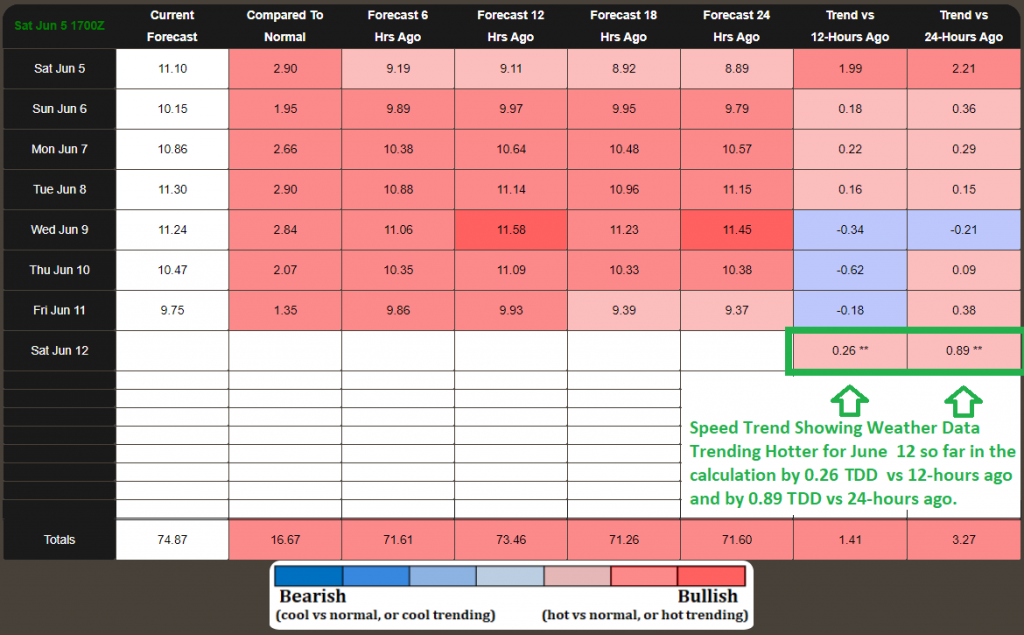
The table above shows how the latest GFS ensemble data is trending as the new forecast for June 12 is processing. In this example, the new 12z run from Saturday June 5 in the image above was adding 0.26 TDD’s vs 12-hours ago and 0.86 TDD vs 24-hours ago.
However, you don’t don’t know how far into that new forecast day the Speed Trend has been calculated. To show this we developed an intraday Speed Trend Table and Graph webpage (click here) that shows how far along the data for the new forecast day has been processed. In the example below, we show how TDDs have trended at each step along the intraday calculation for forecast Day-8. In this example, the data has processed through 00z of forecast Day-8, adding of 0.26 TDDs vs 12-hours ago and 0.89 TDDs vs 24-hours ago, with only a couple more steps to process. As each intraday step of a new forecast day is processed, the Speed Trend Graphs and Tables in this new webpage will update live to show how the forecast TDDs have trended before locking in a final value.
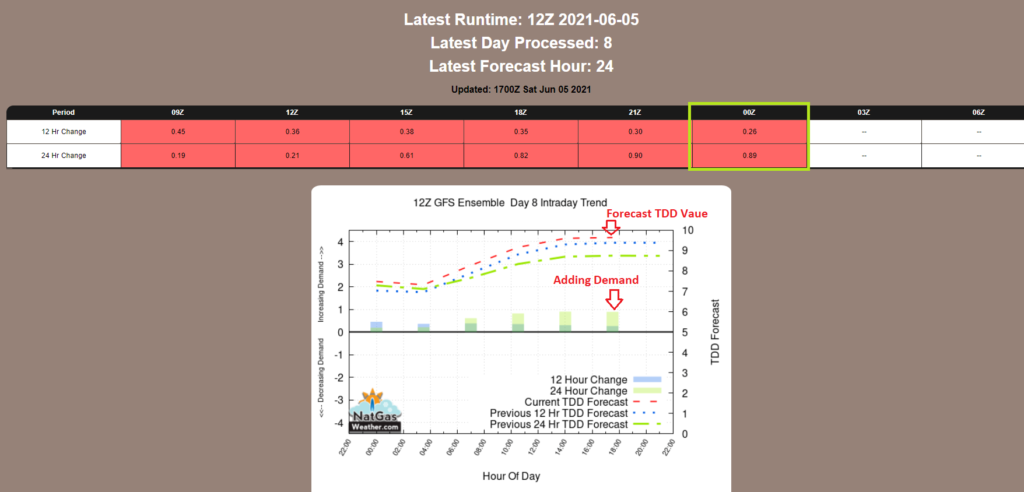
The image is a screenshot from our new Speed Trend Table & Graph page. It shows the trend for forecast Day-8 is adding 0.26 TDDs vs 12-hours ago and 0.89 TDDs vs 24-hours ago, just like the values in the the first image we showed above it. In this case, the data shows the forecast trend to be nearly done for forecast Day-8 at 00z with only a couple more time steps to go before locking in the final intraday HDD/CDD trend for forecast Day-8. The new Speed Trend graphs shows added or lost demand with the scale on the left being TDD trends, and in this case the data is adding demand through hotter trends. The scale on the right shows the forecast TDD for that day and how it compares to runs 12 and 24-hours ago (dashed lines) as it processes the forecast TDD at each step/interval for that day. In this example, the forecast national TDDs are increasing vs 12 and 24-hours ago and will be near 10 TDDs (HDD+CDD) for the final Day-8 calculation.
It’s important to mention, the Speed Trend Graphs and Tables can sometimes be misleading on the first estimate of a new forecast day beginning at Day 9. This is highlighted in the example image below from a GFS ensemble Day-11 forecast. Part of the reason is time steps in the NOAA GFS data increase from 3-hours to 6-hours transitioning to Day-9. Therefore, it’s best to not make any trading decisions on the first estimate of a new forecast beginning at Day-9 and better to wait for the 2nd and 3rd time step estimates as they will be considerably more accurate. Below is an example of where the first step in the new forecast at Day-11 was misleading by showing a colder trend, but immediately flipped to hotter trends at time steps after. Most importantly, the first guess Speed Trend of a new day beginning at Day-9 can be misleading and better to wait for the intraday trends that show up after.
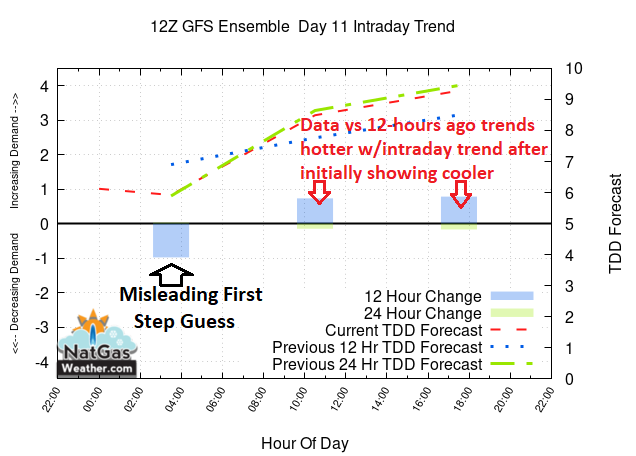
The above image is an example of how a GFS ensemble forecast at Day-11 can be misleading on the first step/guess. In this example, the data suggested a cooler trend at the first intraday time step, but then trending hotter for the following time steps. The point being, at Days 9-16, it’s best to be cautious of the first step in the intraday trend calculation and wait for the following step estimates as they will be considerably more accurate.
We suggest when looking at the Live HDD/CDD data you monitor the values and trends in the tables as normal, but also have the new Speed Graph webpage open where you can see where in the new forecast day the intraday calculation is at. Often times, this will give you numerous minutes lead time on how the HDD/CDD data for that day is trending before it locks in a final value.
Another enhancement that’s been added to our Live HDD/CDD date are EIA regional comparisons between the EC ensemble and GFS ensemble. These new graphs update Live as the new EC model data is processing. Below are a few examples of the new EIA regional EC vs GFS ensemble comparison graphs for the Midwest EIA region.
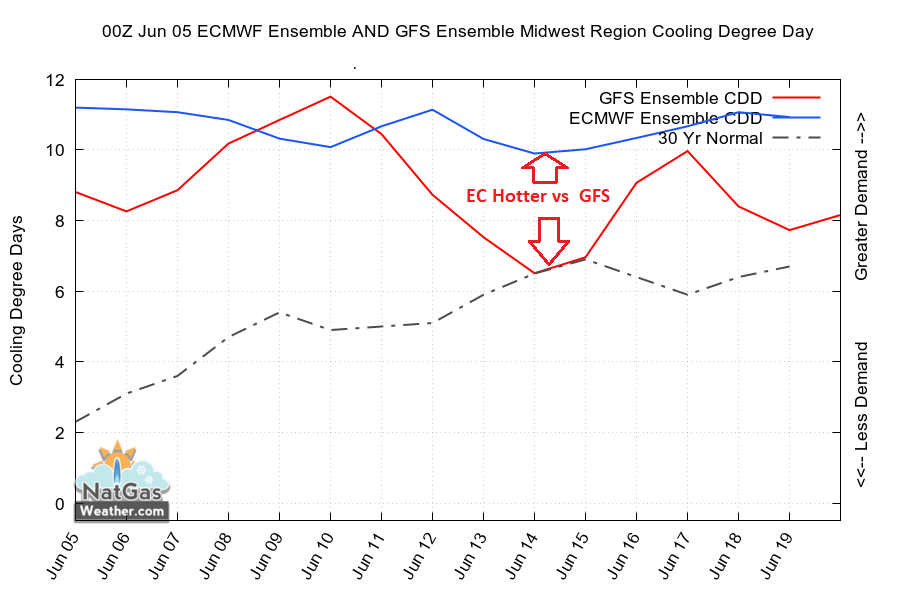
The image above from 0z Saturday June 5 data shows a comparison between the GFS & EC Ensemble CDD forecast for the Midwest EIA Region. The graph shows the EC being a bit hotter than the GFS for the Midwest EIA Region, especially for June 12-19,
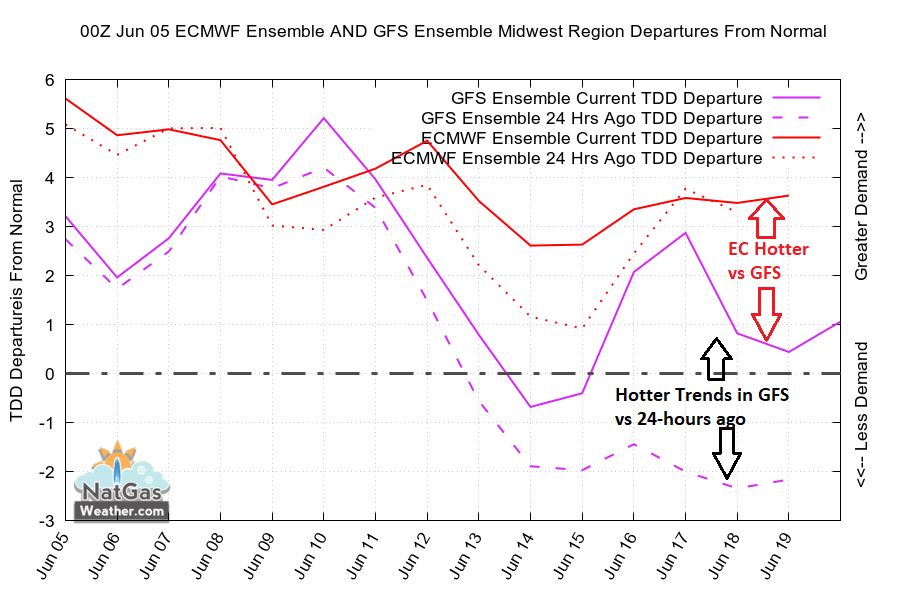
The above images shows how both the GFS and EC Ensemble data for the Midwest EIA Region from the 0z Saturday data has trended compared to their respective runs 24-hours ago, and also shows the comparison between the GFS and the EC Ensembles. In the graph, CDDs from the GFS have trended hotter over the past 24-hours but with the EC being hotter comparatively as it forecasts greater CDDs vs the GFS.